Halloween in the USA: Unravelling American shopping preferences, spending patterns

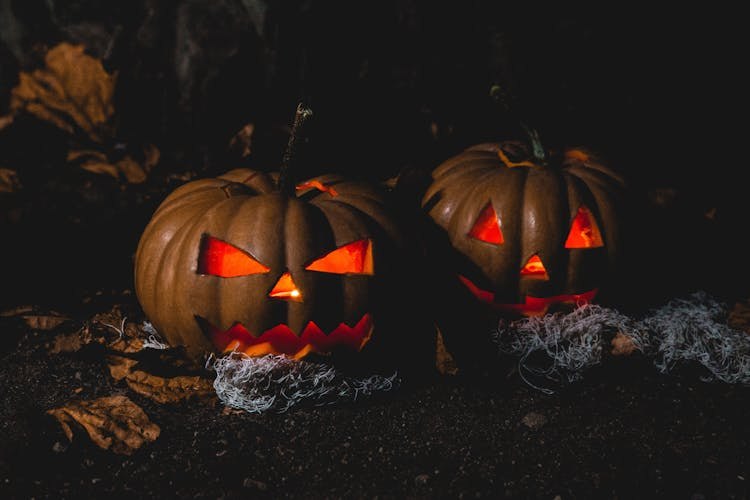
Halloween – a tradition that is said to have Celtic roots, has metamorphosed into a holiday made complete with treats, costumes and pumpkins. In this piece, we’re exploring YouGov data to discuss all things Halloween – how many Americans celebrate it, whether their costumes are store-bought conveniences or DIY wonders and how exactly do they prep for the holiday.
How important is Halloween to Americans?
To start with, nearly three in five Americans (58%) say, compared to other holidays, Halloween is important to them or their families – almost two in five (39%) disagree.
As for Halloween-time activities, watching Halloween-themed movies or shows tops the list (40%), closely followed by decorating homes (39%) and trick-or-treating (31%).
Women are more likely than men, however, to participate in Halloween activities – be it watching on-theme movies or shows (43% vs. 36%), decorating homes (44% vs. 35%) or attending Halloween-themes community events or festivals (24% vs. 16%).
All about costumes
Dressing up in costumes is a Halloween staple (second only to watching out for model Heidi Klum’s elaborate Halloween avatars).
When asked whether Americans make their costumes or buy them, of those Americans that dress up, more than half (53%) say they prefer the best of both worlds – a mix of store-bought items and ones they already have.
Over a third (36%) buy ready-made costumes, while less than one in ten (7%) make costumes from items already at home.
On costume inspiration, personal interests and hobbies triumph (59%) followed by budget considerations (46%) and pop culture trends like movies and TV shows (46%).
Pop culture trends influence men’s Halloween costume choices, more than they influence women’s (52% vs. 41%). But for the rest, women take the lead, with the gap widening the most when it comes to personal interests and hobbies (64% of women and 53% of men) and family or group themes (39% of women and 31% of men).
The ‘what’, ‘how much’ and ‘where’ of Halloween shopping
So, what does Americans’ Halloween shopping timeline look like?
Most shop for specifically Halloween-related items once a year (58%), the rest shopping for it even less often – once every two or three years (18%) and even less than once every three years (11%).
Halloween shopping in American kick-starts towards October, YouGov data suggests.
More than one in ten (12%) start purchasing items for Halloween early September, with a similar proportion (11%) doing so late September. Nearly a quarter of Americans (24%) typically start shopping for Halloween early October, and 15% of them do so mid-October.
No major surprises to see candy top the list (80%) of items typically bought by Americans for the occasion. Decorations come in at a distant second (55%) followed by pumpkins (48%), costume items (46%).
Candy is a Halloween favorite across age groups, but 55+ year olds are most likely to typically shop for it (87%), while 18-to-34-year-olds are the most likely to purchase decorations (61%) and costume items (62%). Pumpkins are most popular as typical Halloween purchases for 35-to-54-year-olds Americans (54%).
A majority of Americans (59%) spend less than $25 on pumpkins, while more than a quarter (27%) spend between $25 and $50 on the fruit.
As for costume items, more than a third (36%) spend between $25 and $50, while less than a quarter (22%) go beyond and spend $51 – $100.
Americans are most likely to spend $25 – $50 on decorations (35%) – party supplies have a similar budget (34%). Two in five Americans spend less than $25 on candy (40%), while a near equal proportion spends between $25 and $50 (39%).
Big box stores like Walmart and Target are the place to go for a majority of Americans (64%) for Halloween-related shopping, followed by local stores (50%) and online retailers (42%).
And finally, discounts never hurt, do they?
A quarter of Americans (25%) take advantage of Halloween sales, discounts or promotions often, and a similar proportion of them (24%) always do so.
A larger chunk of respondents (36%) however take advantage of such promotions sometimes.
Also read: Halloween in Britain: Unravelling British shopping preferences, spending patterns
Explore our living data – for free
Discover more retail content here
Want to run your own research? Run a survey now
Make smarter business decisions with better intelligence. Understand exactly what your audience is thinking by leveraging our panel of 26 million+ members. Speak with us today.
Methodology: YouGov Surveys: Serviced provide quick survey results from nationally representative or targeted audiences in multiple markets. This study was conducted online IN October 2024, with a nationally representative sample of adults (aged 18+ years) in the US, using a questionnaire designed by YouGov. Data figures have been weighted by age, race, gender, education, and region to be representative of all adults in the US (18 years or older), and reflect the latest population estimates from the Census Bureau’s American Community Survey. Learn more about YouGov Surveys: Serviced.
Photo by Toni Cuenca on Pexels
Related
‘American Pickers’ Star Mike Wolfe’s Antiques Shop Faces Backlash for…
American Pickers host Mike Wolfe has recently come under fire, and it has to do with his antiques store, Antique Archaeology, in Nashville. The U.S. Sun has re
S.Coups’ Favorite K-Beauty Brand Is Now Available in America: Shop…
The SEVENTEEN star was announced as the brand ambassador for the skincare brand last year.
The trade war is here. You’ll notice it at the…
Canadians' pocketbooks will likely be the victim of a prolonged trade war with the U.S., with the prices on consumer goods potentially rising over the next week
American booze taken off shelves and stacked in shopping carts…
Open this photo in gallery:A staff member removes bottles of U.S. alcohol from the shelves of a Liquor Control Board of Ontario (LCBO) store, as part of retalia


